
Environment

Environmental conditions are major drivers of crop growth and development and can strongly influence corn and soybean productivity. Weather and soil conditions affect crop establishment, nutrient availability, water use and plant health throughout the growing season. Monitoring these conditions provides important context for understanding differences in crop performance, biomass production and yield across years and management practices.
Environmental Factors:

Precipitation
Precipitation is the primary source of water for corn and soybean production and directly influences seed germination, crop growth and grain development. Both excessive and insufficient rainfall can reduce yield by affecting soil moisture availability, nutrient uptake and field conditions.
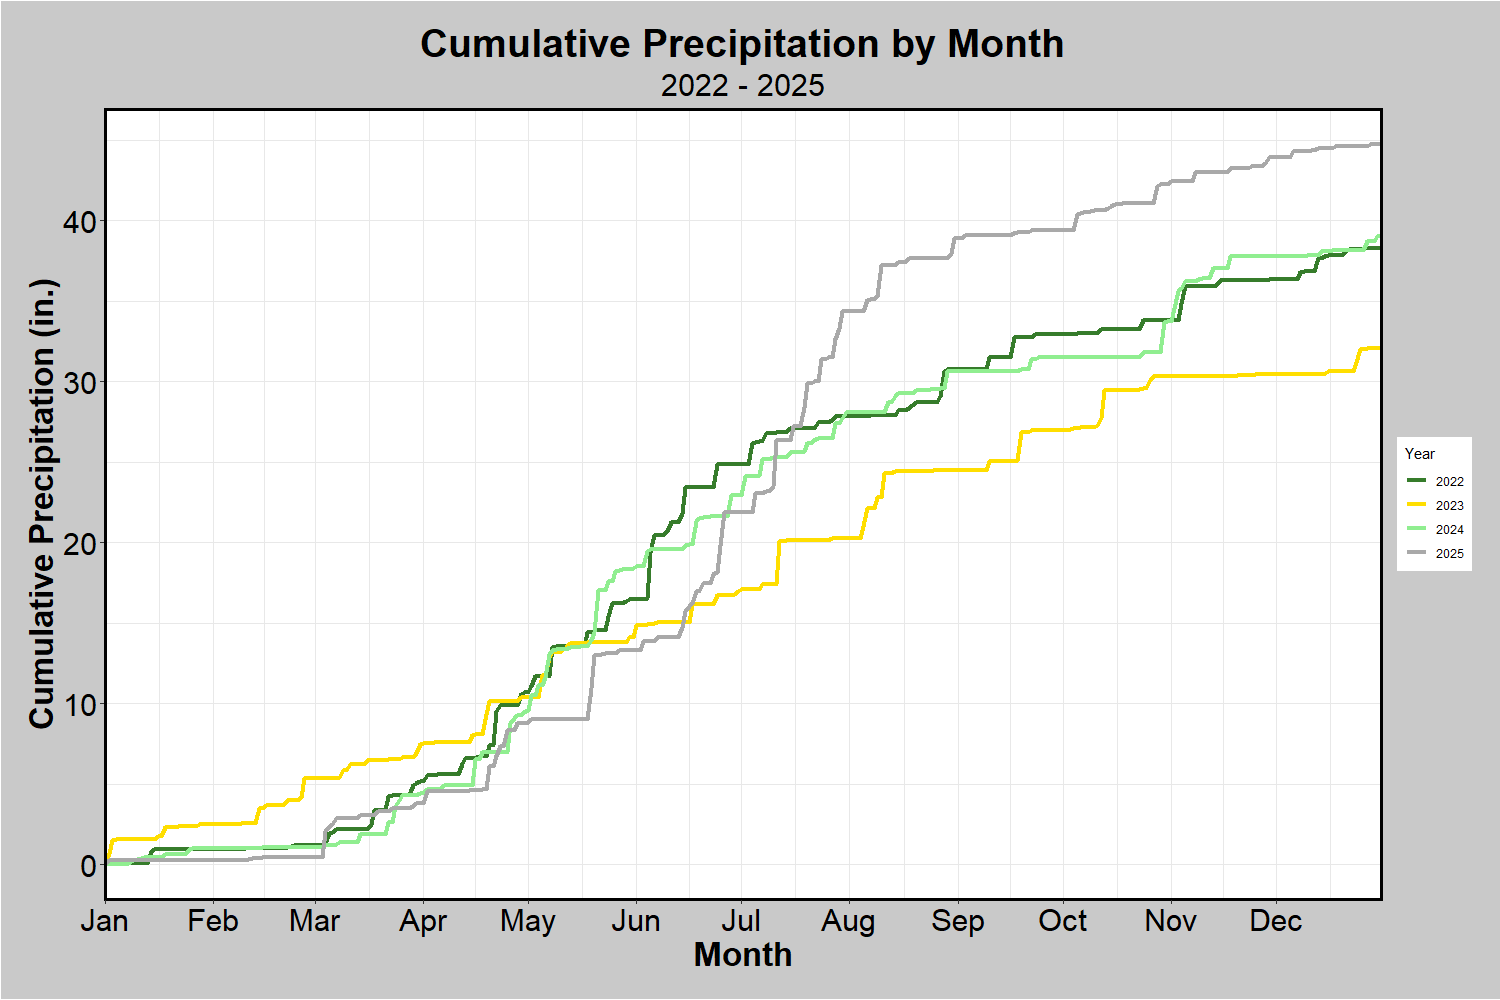
Cumulative precipitation from 2022 through 2025 varied considerably among years, particularly during the primary growing season from May through August. The 2025 season received the greatest cumulative precipitation, with several large rainfall events in mid-summer contributing to approximately 45 inches of total annual precipitation. In contrast, 2023 was the driest year, with approximately 32 inches by the end of the year. Total precipitation in 2022 and 2024 was intermediate at approximately 39 inches, although the timing and intensity of rainfall events differed between the two years.
These year-to-year differences in precipitation influenced crop growth, soil moisture availability, nutrient movement and field conditions throughout the study period. Understanding these variations provides important environmental context for evaluating agronomic and soil health responses across different growing seasons.

Wind
Wind influences crop production by affecting evapotranspiration, soil drying and the movement of pollen, pests and diseases. Strong winds may also cause lodging, reduce pollination efficiency in corn and increase the risk of soil erosion (particularly in fields with limited residue cover). Wind conditions are also a key consideration for pesticide and fertilizer applications, as excessive wind speeds can increase spray drift and reduce application accuracy.
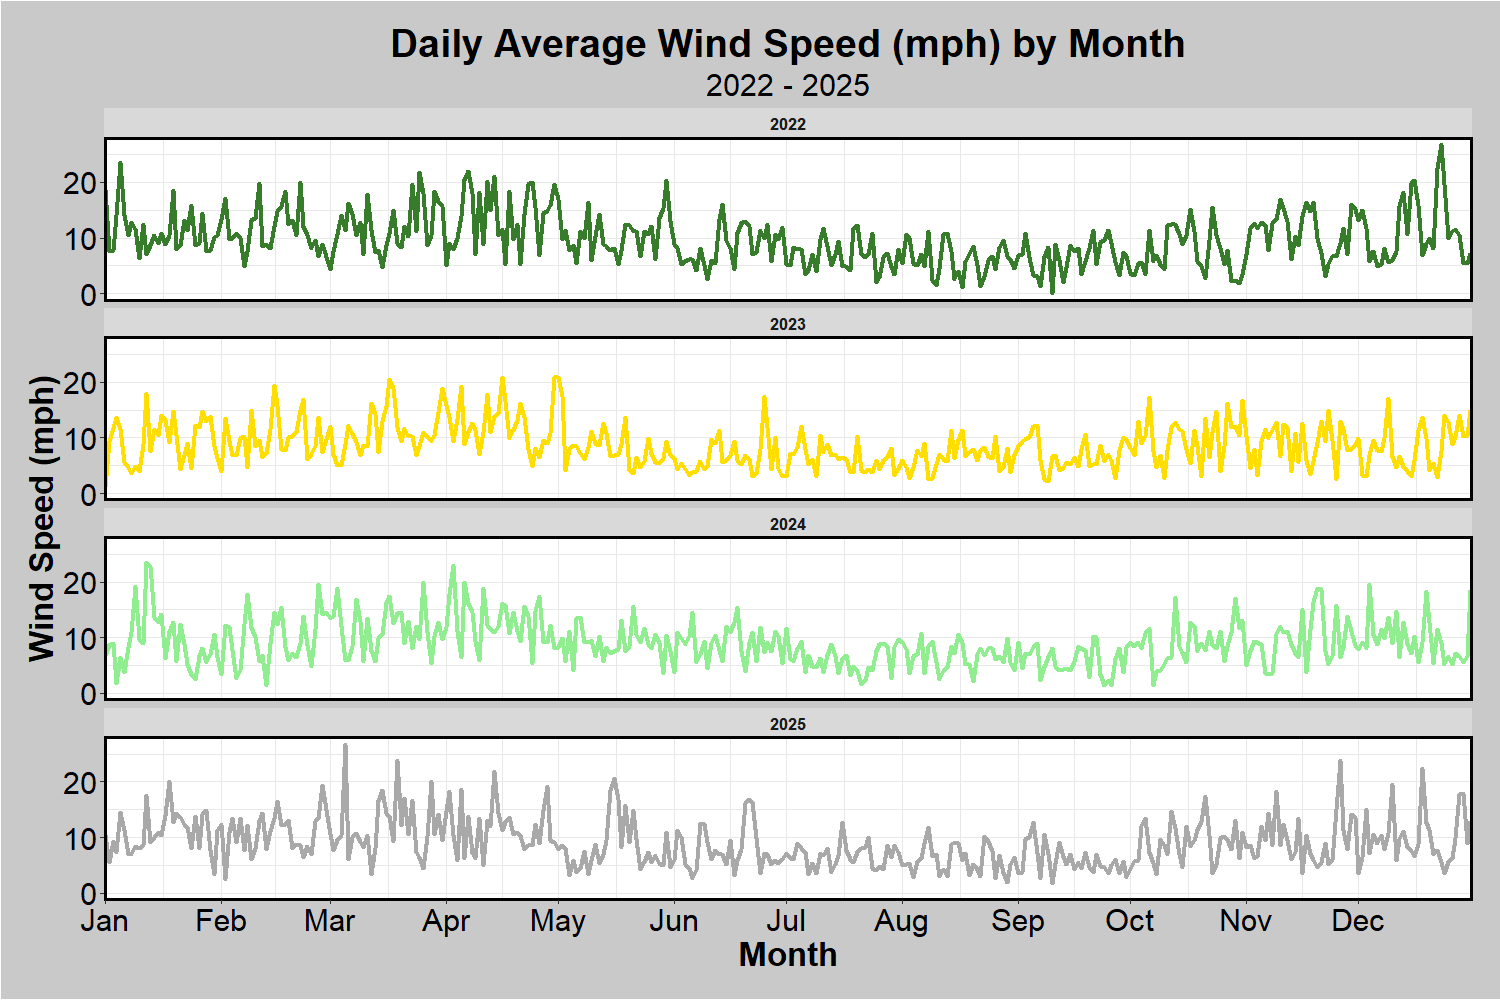
Wind speeds followed similar seasonal patterns from 2022 through 2025, with generally higher and more variable winds during the spring and late fall and lower, more consistent wind speeds during mid-summer. Although year-to-year differences were relatively small, short periods of elevated wind occurred each year, highlighting the importance of monitoring wind conditions when scheduling spraying applications to ensure high application accuracy.

Air Temperature
Air temperature influences crop growth and development by affecting key plant processes such as germination, photosynthesis, flowering and grain fill. Temperature conditions help determine planting timing, crop emergence and the length of the growing season. Extreme temperatures, including cold conditions early in the season or excessive heat during reproductive stages, can negatively affect crop development and reduce yield potential.
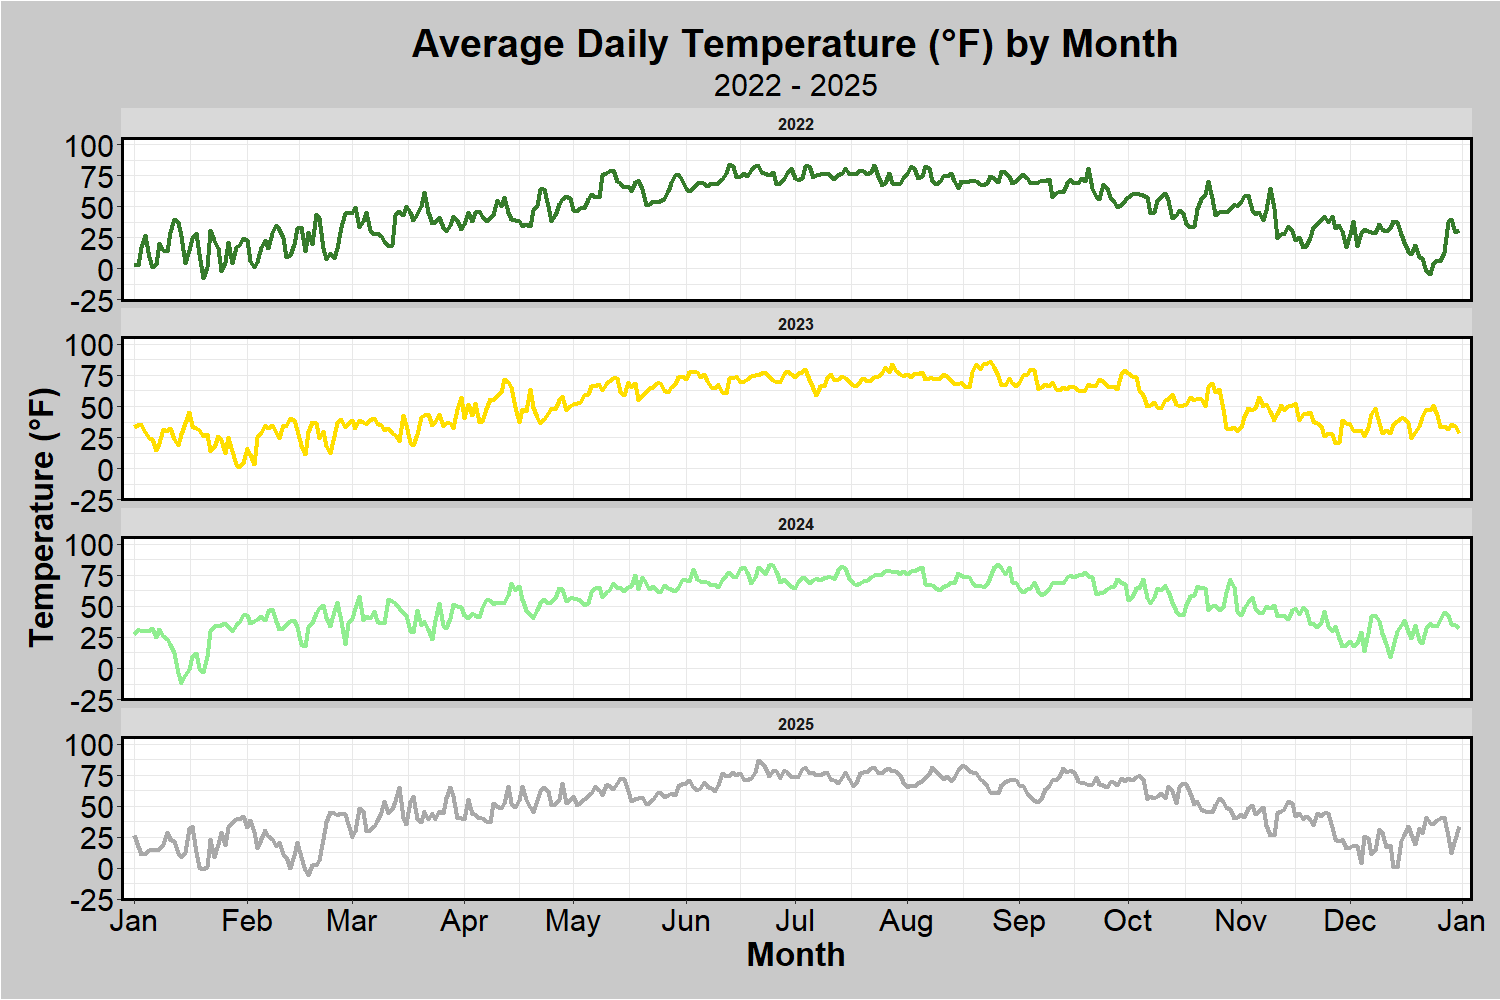
Average daily air temperatures followed a consistent seasonal pattern from 2022 through 2025, increasing from winter into midsummer before gradually declining through the fall. Although overall seasonal trends were similar among years, short-term fluctuations and differences in the timing and duration of warm and cool periods were observed.
These variations in air temperature influenced crop development, planting and harvest timing and environmental conditions throughout the study period.
Soil Temperature and Moisture
Soil temperature and moisture sensors are utilized to collect in-field measurements of 4-inch soil temperatures and soil moisture content for each individual management system. Different tillage practices result in more or less residue on the soil surface during the growing season, which can affect the soil temperature and moisture content due to the interaction of the sun and wind with the soil surface.

Soil temperatures were collected between May 13, 2025, and May 21, 2025, in the corn fields of this study. One key observation is that the conventional tillage field is warmer throughout the month of May compared to the three other treatments, with no-till being the coolest. Soil temperature is highest in the conventional tillage field given the lack of residue on the soil surface, which results in the sun directly hitting and warming the soil. The no-till field is the coolest given the increase in soil surface residue, which shades the soil from solar warming.
Explore Soil Temperature in Corn and Soybean by Year!


Average soil water content from April 20 to May 18, 2024, showed that strip till maintained the highest soil moisture levels, while conventional tillage consistently had the lowest. Fluctuations in soil moisture corresponded with rainfall events, when sensors detected rapid increases in moisture. Following rainfall, soil moisture gradually decreased, providing insight into soil drying patterns that can help inform planting timing.
Explore Average Water Content in Corn and Soybean by Year!


Environmental conditions are major drivers of crop growth and development and can strongly influence corn and soybean productivity. Weather and soil conditions affect crop establishment, nutrient availability, water use and plant health throughout the growing season. Monitoring these conditions provides important context for understanding differences in crop performance, biomass production and yield across years and management practices.
Environmental Factors:
Precipitation
Precipitation is the primary source of water for corn and soybean production and directly influences seed germination, crop growth and grain development. Both excessive and insufficient rainfall can reduce yield by affecting soil moisture availability, nutrient uptake and field conditions.
Figure 1. Precipitation: The figure illustrates cumulative precipitation from 2022 through 2025. Rainfall patterns varied considerably among years, particularly during the primary growing season from May through August. The 2025 season received the greatest cumulative precipitation, with several large rainfall events in mid-summer contributing to approximately 45 inches of total annual precipitation. In contrast, 2023 was the driest year, with approximately 32 inches by the end of the year. Total precipitation in 2022 and 2024 was intermediate at approximately 39 inches, although the timing and intensity of rainfall events differed between the two years.
These year-to-year differences in precipitation influenced crop growth, soil moisture availability, nutrient movement and field conditions throughout the study period. Understanding these variations provides important environmental context for evaluating agronomic and soil health responses across different growing seasons.
Wind
Wind influences crop production by affecting evapotranspiration, soil drying and the movement of pollen, pests and diseases. Strong winds may also cause lodging, reduce pollination efficiency in corn and increase the risk of soil erosion (particularly in fields with limited residue cover). Wind conditions are also a key consideration for pesticide and fertilizer applications, as excessive wind speeds can increase spray drift and reduce application accuracy.
Figure 2. Wind: As shown in the figure, wind speeds followed similar seasonal patterns from 2022 through 2025, with generally higher and more variable winds during the spring and late fall and lower, more consistent wind speeds during mid-summer. Although year-to-year differences were relatively small, short periods of elevated wind occurred each year, highlighting the importance of monitoring wind conditions when scheduling spraying applications to ensure high application accuracy.
Air Temperature
Air temperature influences crop growth and development by affecting key plant processes such as germination, photosynthesis, flowering, and grain fill. Temperature conditions help determine planting timing, crop emergence and the length of the growing season. Extreme temperatures, including cold conditions early in the season or excessive heat during reproductive stages, can negatively affect crop development and reduce yield potential.
Figure 3. Air Temperature: The figure shows that average daily air temperatures followed a consistent seasonal pattern from 2022 through 2025, increasing from winter into midsummer before gradually declining through the fall. Although overall seasonal trends were similar among years, short-term fluctuations and differences in the timing and duration of warm and cool periods were observed.
These variations in air temperature influenced crop development, planting and harvest timing and environmental conditions throughout the study period.
Soil Temperature and Moisture
Soil temperature and moisture sensors are utilized to collect in-field measurements of 4-inch soil temperatures and soil moisture content for each individual management system. Different tillage practices result in more or less residue on the soil surface during the growing season, which can affect the soil temperature and moisture content due to the interaction of the sun and wind with the soil surface. Compare differences in spring soil temperatures and soil moisture across management systems below.
Soil Temperature
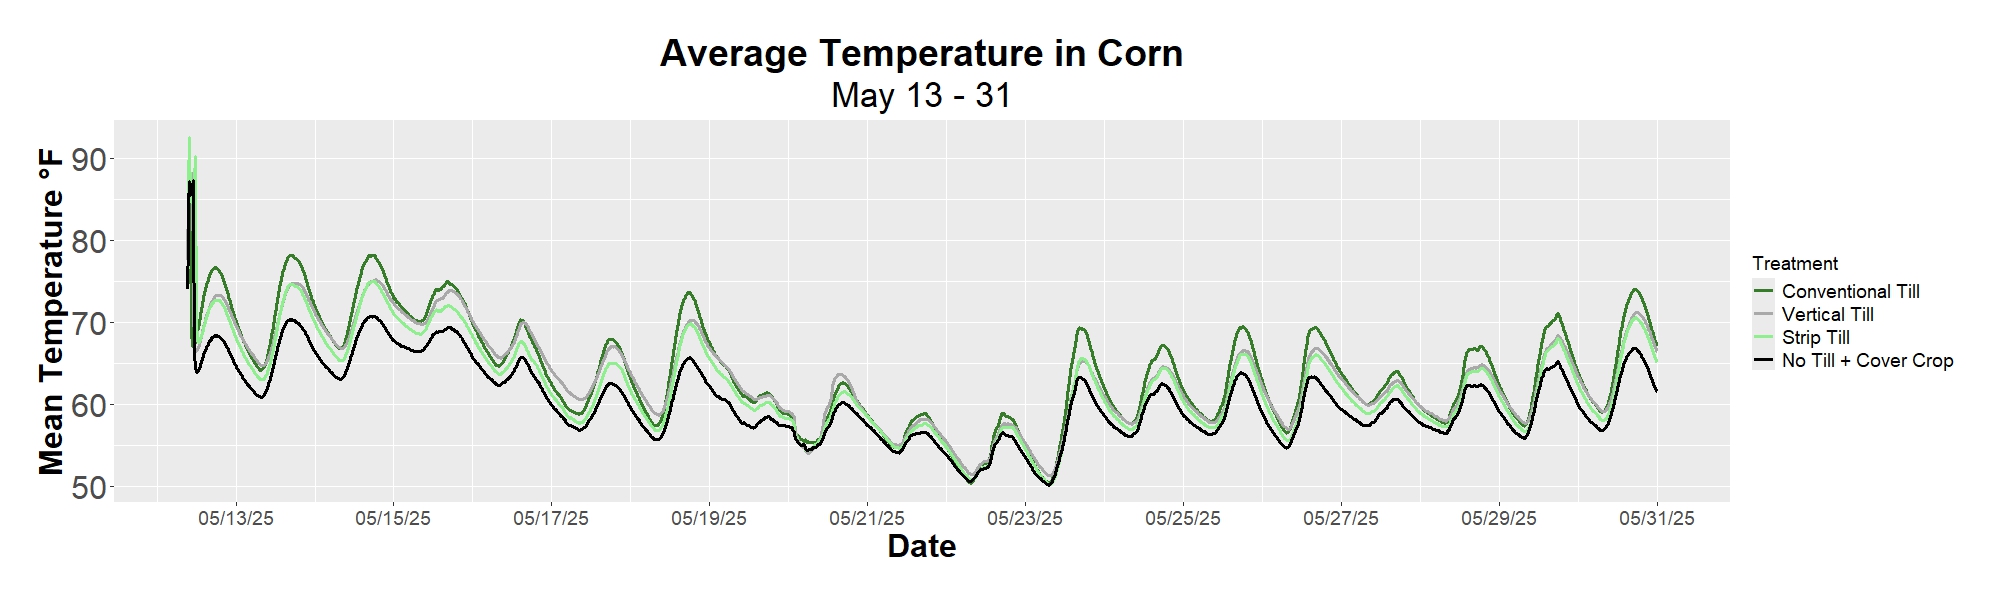
Figure 4. Soil Temperature: The graph displays soil temperature collected between May 13, 2025, and May 21, 2025, in the corn fields of this study. One key observation is that the conventional tillage field is warmer throughout the month of May compared to the three other treatments, with no-till being the coolest. Soil temperature is highest in the conventional tillage field given the lack of residue on the soil surface, which results in the sun directly hitting and warming the soil. The no-till field is the coolest given the increase in soil surface residue, which shades the soil from solar warming.
Explore Soil Temperature in Corn and Soybean by Year!
Soil Moisture
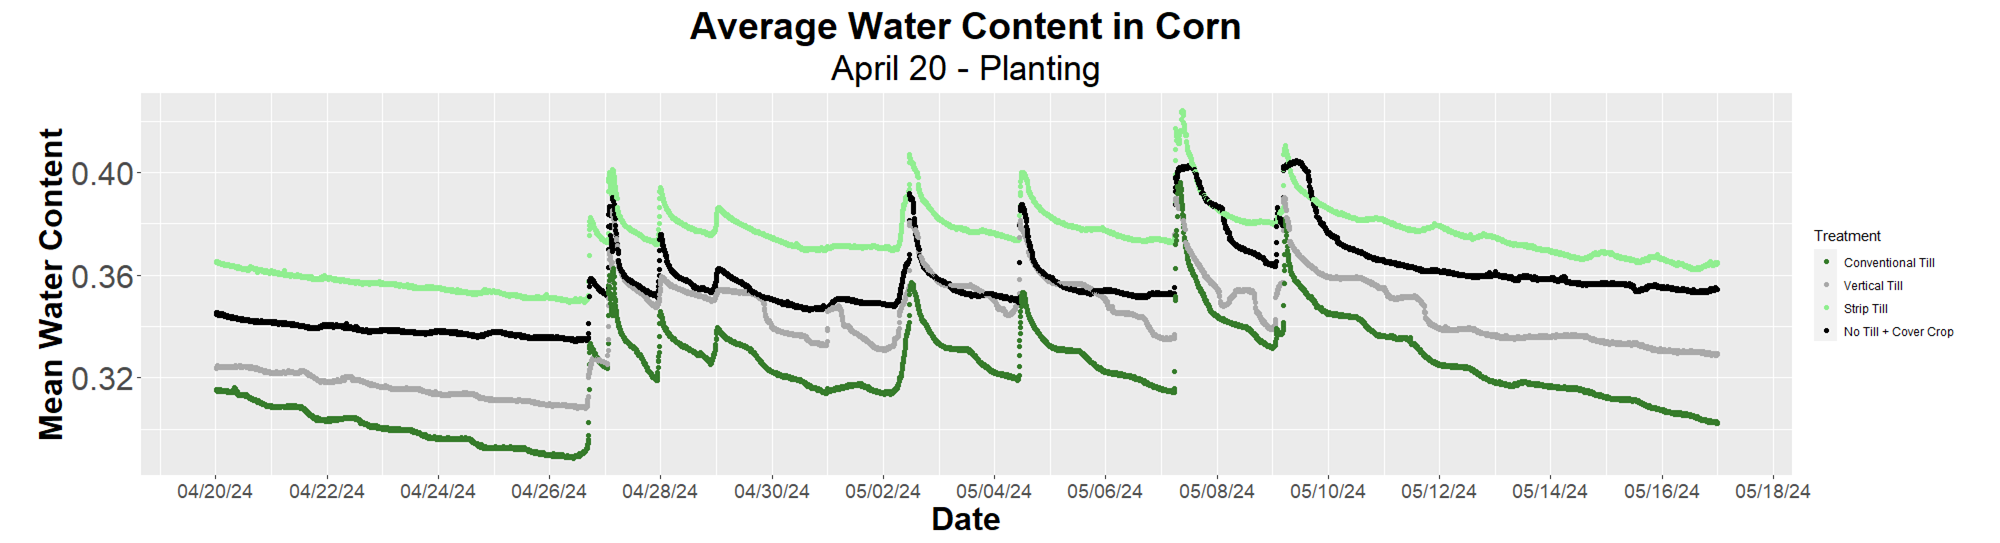
Figure 5. Soil Moisture: The graph displays average soil water content between April 20th, 2024 and May 18th, 2024. The first key observation to make is that strip till remains the wettest while conventional is consistently the driest. The second observation to make is that the areas on the graph where the data appears choppy is where rainfall occurred and the moisture sensors detected a rapid increase in soil moisture. We can then observe the behavior of soil moisture decreasing following a rainfall event which is helpful in determining planting timing.
Explore Average Water Content in Corn and Soybean by Year!