
Crop Yield Datasets

Measuring Crop Productivity with Crop Yields
Crop yield is one of the primary indicators of crop productivity and is widely used to evaluate the effectiveness of agricultural management practices. Measuring yield provides a direct assessment of crop performance by integrating the effects of environmental conditions, soil properties and management decisions throughout the growing season.
As a result, yield is commonly used to compare the agronomic and economic performance of different tillage systems, crop rotations and nutrient management strategies.
What Are The Units for Yield Measurements?
In the United States, corn and soybean yields are commonly measured in bushels per acre. A bushel is a standardized unit used for measuring dry volume and is common for measuring grain, such as corn and soybeans. For shelled corn, a bushel equates to about 56 lbs; for soybeans, a bushel typically weighs 60 lbs.
An acre is a standardized unit of land area that is commonly used in measuring agricultural farmland. By combining bushels and acres into a single measurement, we can gain a deeper understanding of the amount of grain harvested (bushels) within a given area (acres).
Yield Maps
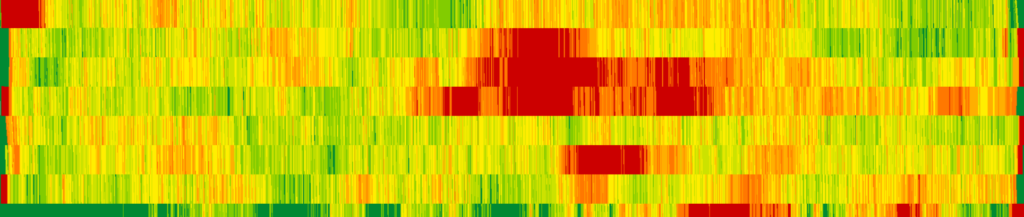
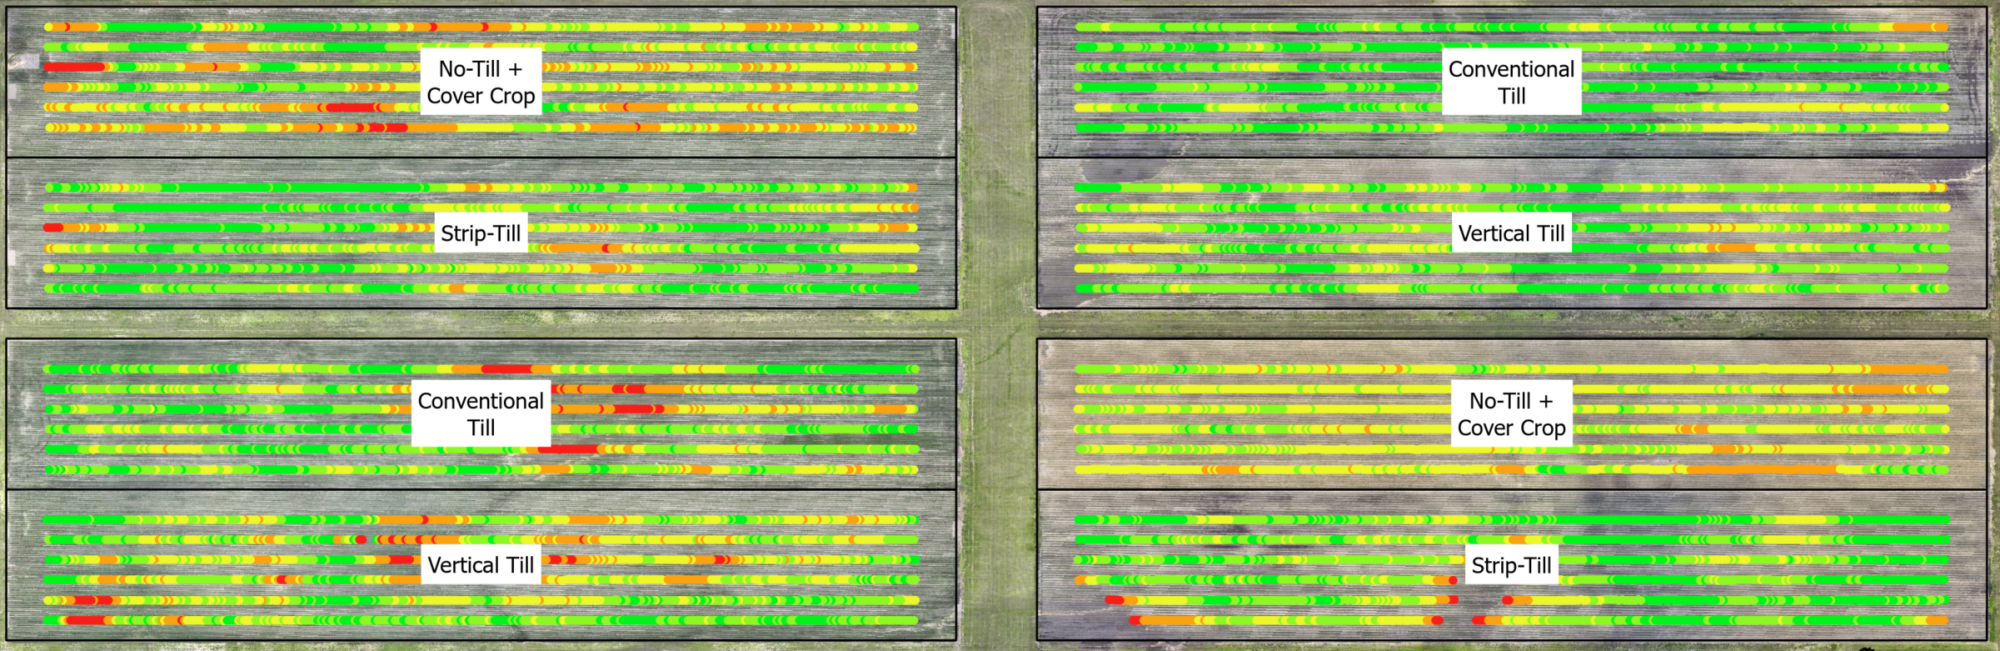
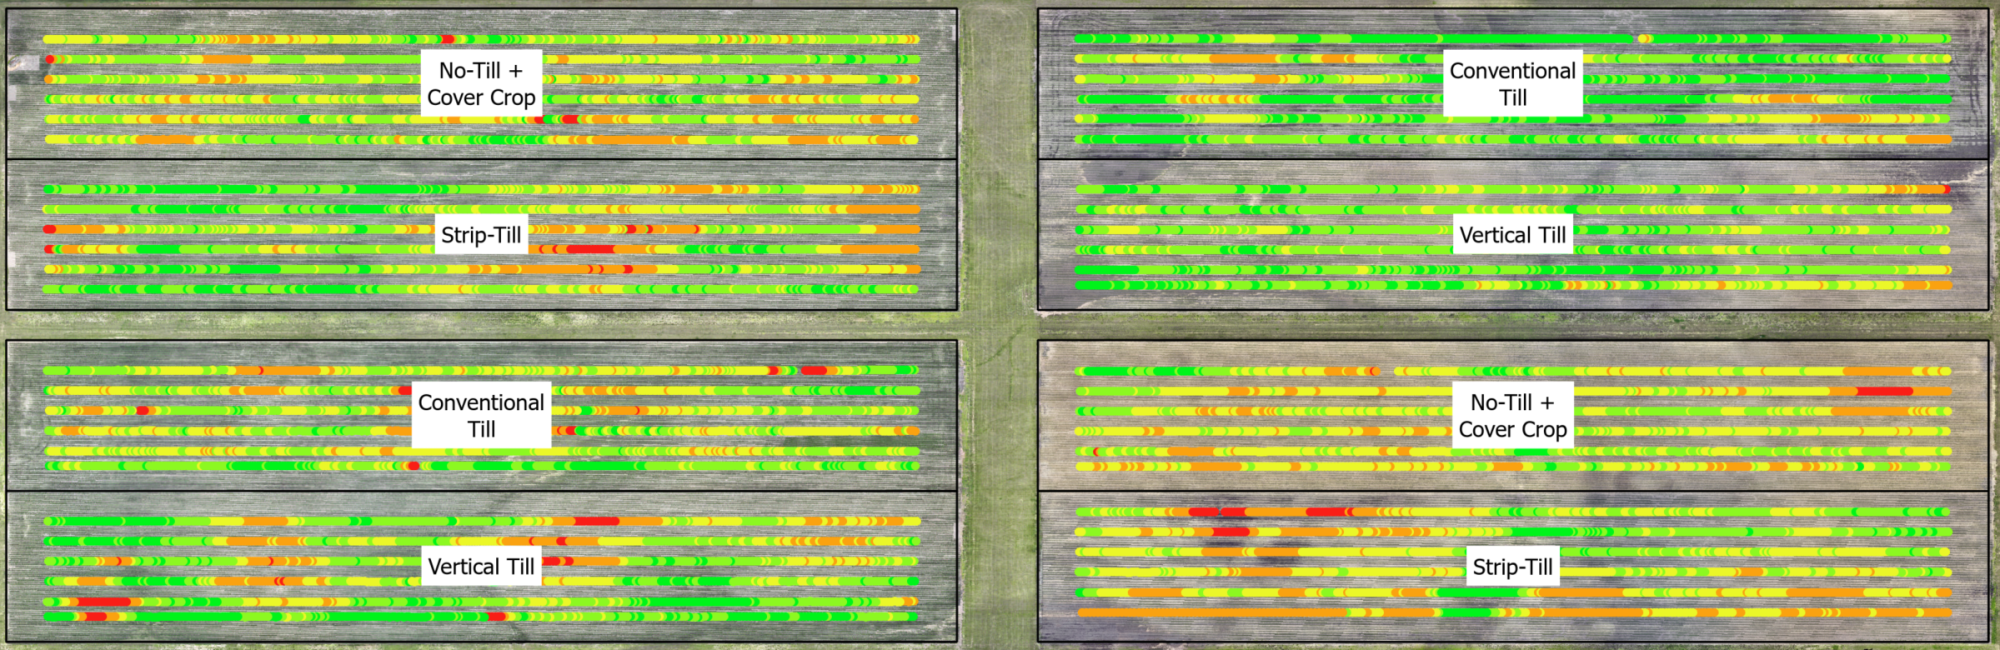
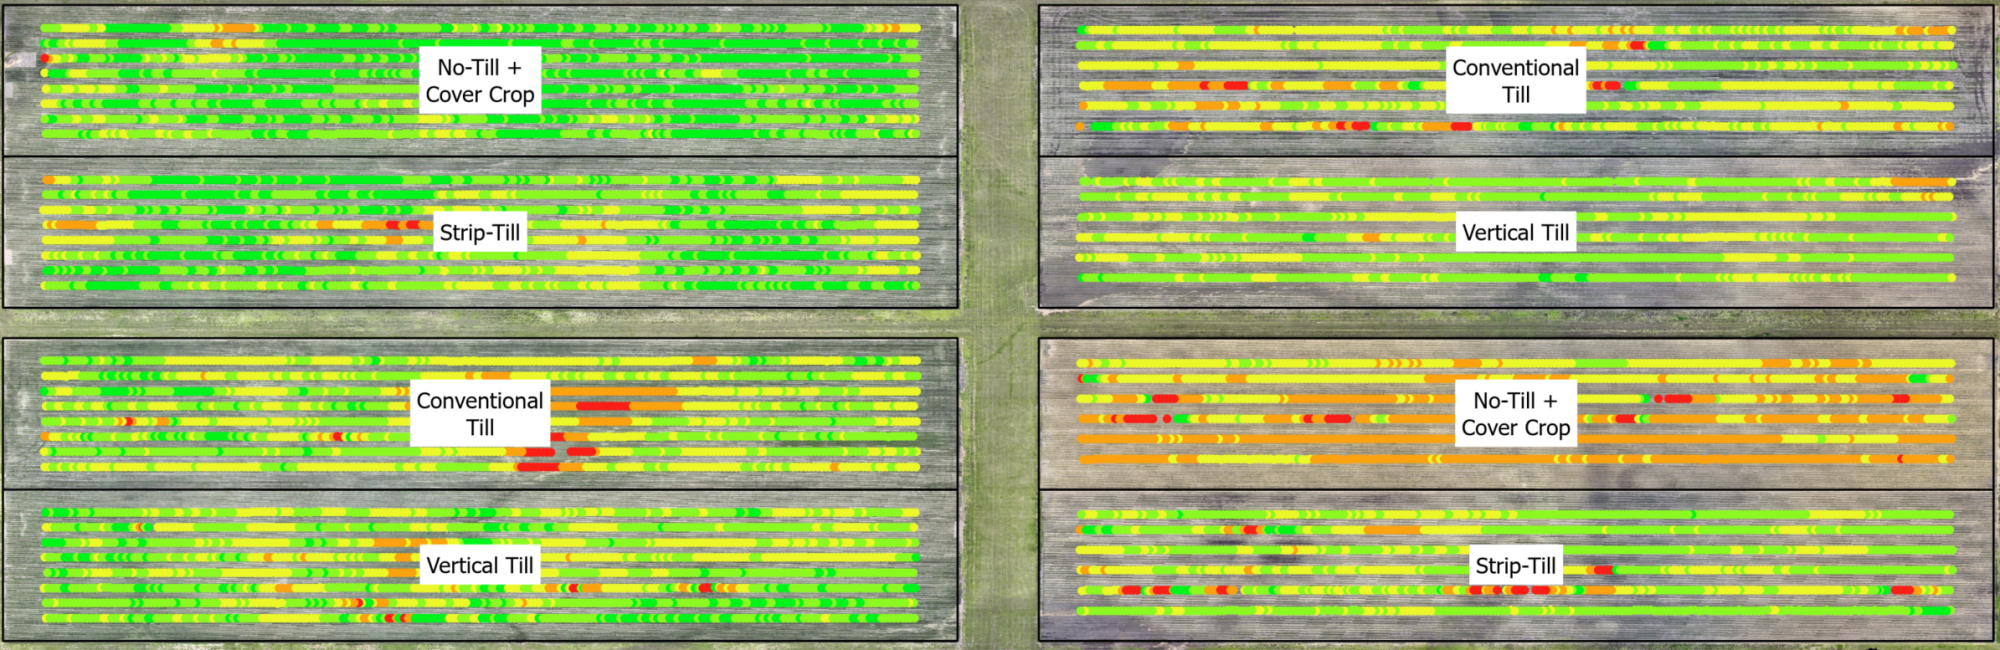
Yield maps visualize crop yield and help identify how soil, environmental and agronomic factors influence production. They can reveal areas affected by nutrient deficiencies, insect damage, disease pressure or variations in precipitation, including both drought and excess moisture. Examining yield maps helps identify patterns in crop performance and the factors contributing to yield variability.

Average Yield
Average yield provides a simple way to compare crop productivity across fields, treatments or growing seasons by summarizing overall performance into a single value. It can highlight long-term trends while reducing the influence of small-scale variability within a field.
When combined with soil characteristics, management practices and environmental conditions, average yield provides a useful benchmark for evaluating different production systems and management strategies. Comparing multi-year and individual-year averages can also reveal both long-term trends and year-to-year differences in crop performance.


Multi-Year Average Yield
A multi-year average yield summarizes crop productivity across several growing seasons, providing a more stable measure of long-term field performance. Averaging across years reduces the influence of unusual weather, pest pressure and other seasonal variability, making consistent management trends easier to identify. However, it can also mask exceptionally high- or low-performing seasons and specific impacts from weather or management decisions.
Although fields varied in elevation and soil characteristics, each management treatment was replicated across multiple fields and landscape positions. This reduced the influence of site-specific conditions, while multi-year averages further minimized annual variability and allowed long-term treatment performance to be evaluated across a range of growing conditions.

Average Corn Yields Year by Year
Average corn yield can be compared across tillage treatments and growing seasons from 2022 through 2025. While treatment rankings remained relatively consistent, all treatments showed similar year-to-year responses, indicating that annual growing conditions were a major driver of yield variability alongside treatment effects.

Average Soybean Yields Year by Year
Average soybean yield can be compared across tillage treatments and growing seasons from 2022 through 2025. Yield rankings remained relatively consistent from year to year, suggesting that tillage treatments had similar effects despite variability in growing-season conditions.
Average Corn Yields Year by Year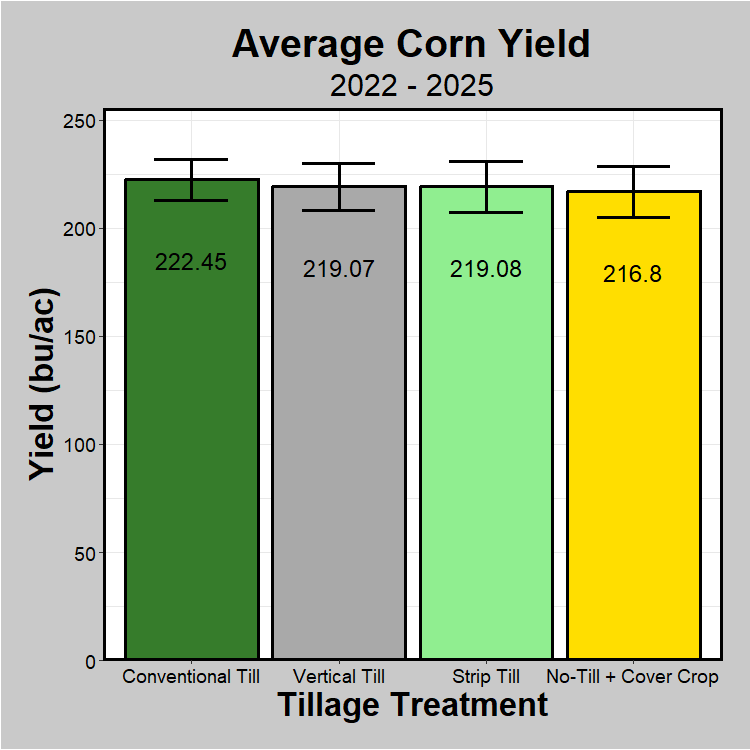
Average corn yield can be compared across tillage treatments and growing seasons from 2022 through 2025. While treatment rankings remained relatively consistent, all treatments showed similar year-to-year responses, indicating that annual growing conditions were a major driver of yield variability alongside treatment effects.
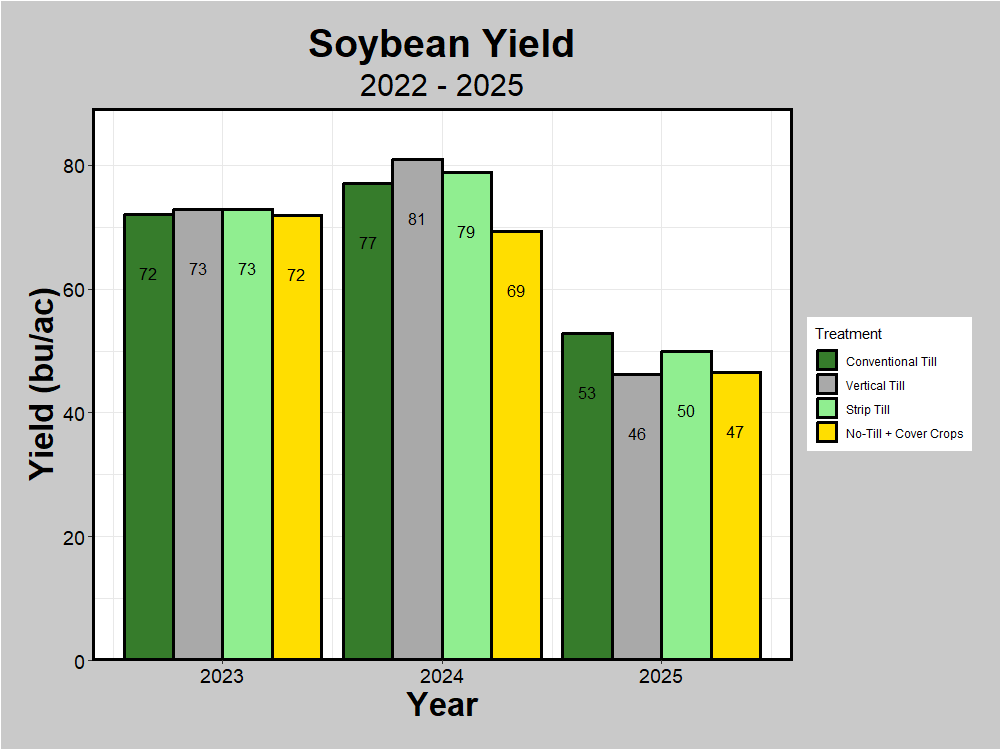 Average Soybean Yields Year by Year
Average soybean yield can be compared across tillage treatments and growing seasons from 2022 through 2025. Yield rankings remained relatively consistent from year to year, suggesting that tillage treatments had similar effects despite variability in growing-season conditions.
Individual Year Average Yield
Evaluating yield by individual year provides insight into how fields and management practices respond to specific growing conditions. This approach can reveal the effects of weather, crop rotation, nutrient management and other environmental factors on productivity during a single season.
Year-by-year analysis helps identify seasonal trends and explain differences in yield across years. However, single-year results can be strongly influenced by environmental conditions and may not reflect the long-term productivity or consistency of a field or management practice.

Average Corn Yields Year by Year
Average corn yield for each tillage treatment can be compared across years from 2022 through 2025. While treatment rankings remained relatively consistent, all treatments exhibited similar responses across years, indicating that annual growing conditions were a primary driver of yield variability in addition to treatment-related effects.

Average Soybean Yields Year by Year
Average soybean yield for each tillage treatment can be compared across each year from 2022 through 2025. Yield rankings remained relatively consistent from year to year, indicating that tillage treatments had similar effects despite variability in growing-season conditions.
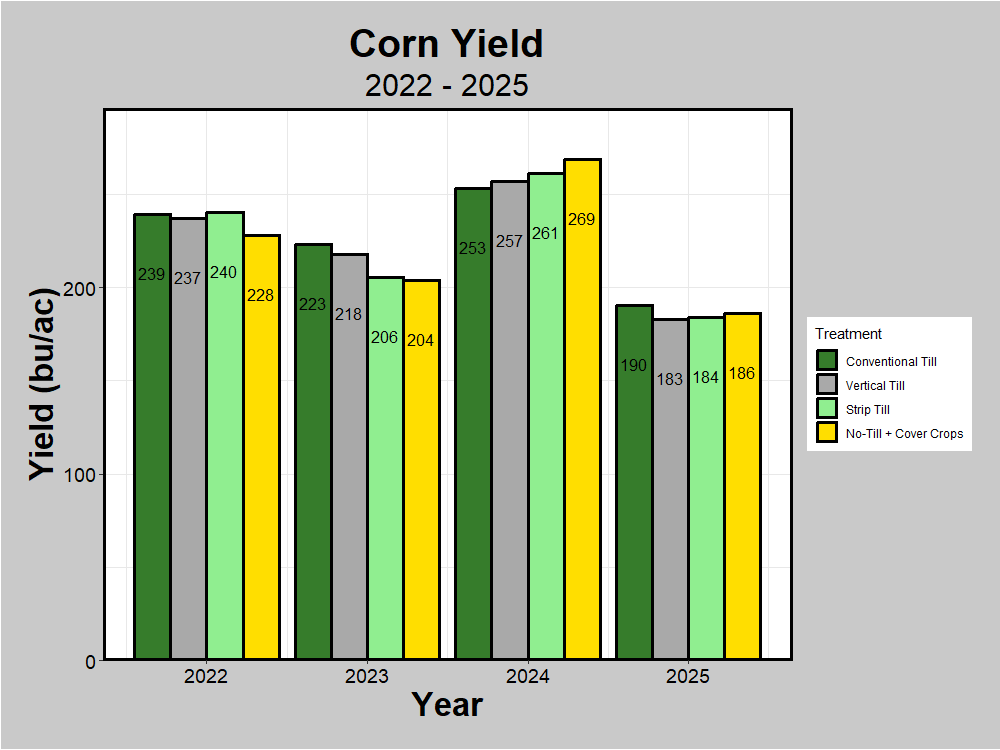 Average Corn Yields Year by Year
Average corn yield for each tillage treatment can be compared across years from 2022 through 2025. While treatment rankings remained relatively consistent, all treatments exhibited similar responses across years, indicating that annual growing conditions were a primary driver of yield variability in addition to treatment-related effects.
 Average Soybean Yields Year by Year
Average soybean yield for each tillage treatment can be compared across each year from 2022 through 2025. Yield rankings remained relatively consistent from year to year, indicating that tillage treatments had similar effects despite variability in growing-season conditions.